
Economic Indicators and Their Impact on Real Estate Valuation
By Scott A. Stanfield

The valuation of real estate is intricately linked to the broader economic environment. Economic indicators play a pivotal role in shaping market dynamics, influencing property values, and informing investment decisions. This article explores key economic indicators, their relevance to real estate, and how they can be quantitatively analyzed to assess real estate valuation.
Gross Domestic Product (GDP)
GDP is a primary indicator of a country’s economic health, reflecting the total market value of all goods and services produced over a specific period. A growing GDP indicates economic expansion, which generally leads to increased demand for real estate, pushing up property values and rents. Correlations between GDP growth rates and real estate market performance helps to predict how changes in economic output affects real estate demand.
Employment Rates
Employment levels directly affect real estate markets, particularly residential and commercial sectors. Higher employment rates increase housing demand due to higher disposable income and boost commercial real estate through the demand for office space and retail locations. A time series analysis evaluating employment rates and real estate prices over time can reveal patterns and help forecast future market trends.
Interest Rates
Interest rates, set by the central bank, influence borrowing costs for mortgages and real estate development loans, lower interest rates make borrowing cheaper, encouraging investment in real estate and driving up property prices. The relationship between interest rates and property values can be modeled using econometric methods, assessing the impact of monetary policy changes on the real estate market.
Inflation Rates
Inflation affects the real estate market by increasing construction costs and property values over time. Real estate is often considered a hedge against inflation because property values and rents typically increase with inflation. To help understand the inflation-hedging properties of real estate, you can analyze historical inflation rates and real estate appreciation rates using regression models.
Consumer Confidence Index
The Consumer Confidence Index (CCI) measures how optimistic or pessimistic consumers are regarding their expected financial situation. A higher CCI generally leads to increased spending, including on real estate, buoying the market.
- Case Study: By examining CCI data alongside real estate sales and price data, analysts can use predictive analytics to gauge market sentiment and its impact on real estate demand.
- Case Study: By examining CCI data alongside real estate sales and price data, analysts can use predictive analytics to gauge market sentiment and its impact on real estate demand.
Figure 1. CCI Percent Change
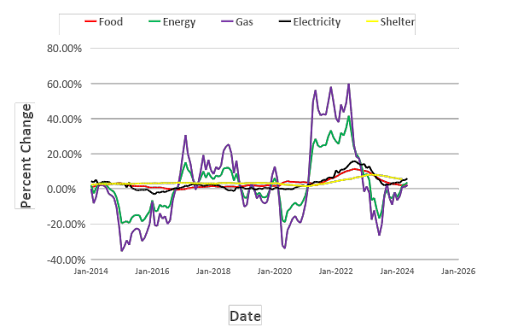
In Figure 1, the percent change in the CCI over the last ten years illustrates how consumer sentiment has evolved over time. Since the CCI measures consumer optimism or pessimism, it is important to consider how different economic events influence public perception of the market. Changes in crowd psychology significantly impact the CCI.
One notable example in Figure 1 is the percent change in the CCI for gas. From the end of 2019 to the end of 2020, the CCI experienced a negative change. This period corresponds to the COVID-19 quarantine, during which the population consumed less gas due to reduced travel. The negative change in the CCI accurately reflects the decreased spending on gas during this time.
Figure 2. How the CCI (%) and Average Interest Rates Correlate to Home Sales
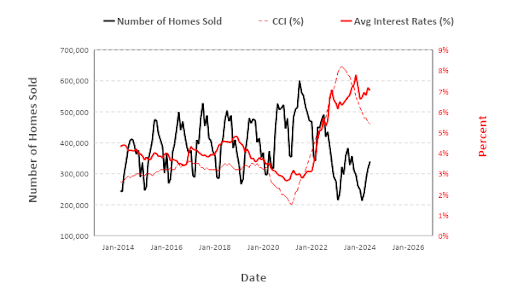
Even though Figure 1 shows how the CCI has changed for shelter, it does not tell the whole story. To better understand the correlation between the CCI and the housing market, it is more insightful to analyze a plot of home sales and the overall CCI over time, rather than the percent change in CCI.
Figure 2 shows the number of homes sold, the average interest rate, and the overall CCI for the last ten years. Before interpreting Figure 2, it is worth mentioning that home sales exhibit seasonal variations, as evidenced by the peaks and troughs in the figure. The relationship between the CCI and the number of homes sold might not be immediately apparent.
To uncover this relationship, further statistical analysis, such as a cross-correlation, can be performed. This analysis provides a correlation coefficient and a time lag. The correlation coefficient indicates whether the two series are correlated, inversely correlated, or not correlated. The time lag reveals how much time the lagging series takes to react to the leading series.
A visual interpretation is as follows: Starting from January 2014 and moving to more recent dates, the CCI has a local peak in December 2016, while the number of homes sold peaks in July 2017. Both the number of homes sold and the CCI maintain a similar rate of increase. The trough in February 2018 breaks this trend, indicating that the CCI leads the number of homes sold by approximately six to seven months. This lag in home sales relative to the CCI is evident when comparing the all-time lows and highs between the two. Inspecting the time series for later dates shows a similar correlation. This lag is caused by several factors, including the time-consuming home purchasing process and the rate at which market participants absorb and react to economic news.
In summary, the number of homes sold is positively correlated with the CCI and inversely (negatively) correlated with mortgage interest rates. When consumers are confident and mortgage rates are low, house sales tend to increase. Conversely, when consumer confidence is low and mortgage rates are high, house sales typically decrease.
Conclusion
Economic indicators are essential tools for understanding and predicting real estate market trends. Quantitative analysis of these indicators allows investors and analysts to make informed decisions based on concrete data, aligning investment strategies with economic realities. While quantitative analysis provides a robust framework for evaluating the impact of economic indicators on real estate valuation, it’s crucial to consider these analyses within the broader market context, including regulatory changes and unforeseen economic events.
Thanks for reading,
-Scott
Further Reading
Data for CCI: Consumer Price Index (CPI) Databases : U.S. Bureau of Labor Statistics (bls.gov)