
Understanding Real Estate Market Dynamics: A Statistical Approach
By Scott A. Stanfield

Introduction
Real estate market dynamics are complex, influenced by numerous factors ranging from economic conditions to societal trends. A statistical approach to understanding these dynamics can provide valuable insights for investors, developers, and policymakers. This article explores key statistical methodologies used to analyze real estate market trends and their practical applications.
The Importance of Data in Real Estate Analysis
The foundation of any statistical analysis is data. In context of real estate, this includes sales prices, rental rates, occupancy rates, construction activity, and economic indicators like the Gross Domestic Product (GDP) growth rates and unemployment rates. Collecting, cleaning, and organizing this data is the first step in applying a statistical approach to real estate market analysis.
- Gross Domestic Product (GDP): Examining GDP allows you to gauge economic conditions by reflecting the monetary value of goods and services within different metropolitan areas.
- In 2023, the average percent change in the GDP for the United States was 2.5. Figure 1 provides a simplistic view showing how each state varies from this 2.5 average. You can further narrow this analysis down from the state level to local metropolitan areas. States highlighted in dark blue and turquoise have economies performing better than the national average, while states in light blue have economies performing near the average, and states in orange are performing below the national average. When looking for areas to invest in, thriving economies (such as those in dark blue and turquoise) are one factor that should be taken into consideration.
- Gross Domestic Product (GDP): Examining GDP allows you to gauge economic conditions by reflecting the monetary value of goods and services within different metropolitan areas.
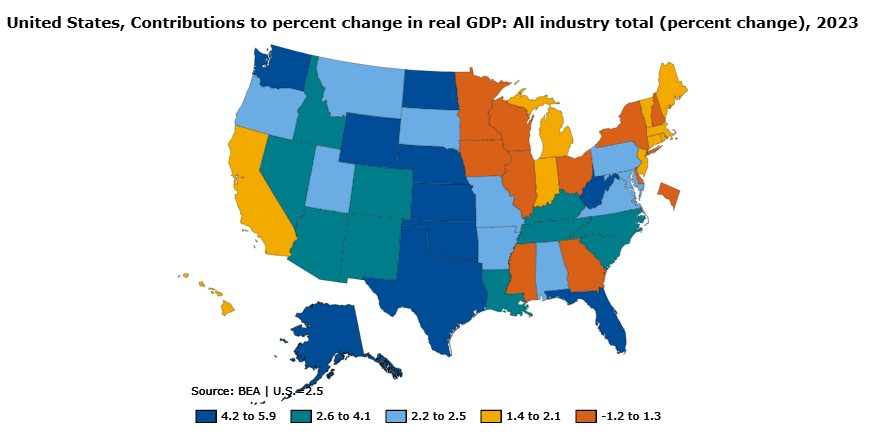
Figure 1. GDP shown as a percent change from the national average. (Source: https://apps.bea.gov/itable).
Time Series Analysis in Real Estate
Time series analysis is crucial for examining how specific variables change over time and identifying trends that can inform investment decisions. For example, analyzing the time series data of housing prices in a particular area can reveal patterns of growth, stability, or decline, which are indicative of the market’s overall health and trajectory.
- Autoregression Models: These models predict future behavior based on past values. In real estate, they can forecast future property prices based on historical price data.
- Seasonality: Identifying and adjusting for seasonal effects in housing demand or rental rates can improve the accuracy of market analyses and forecasts.
Regression Analysis for Market Predictions
Regression analysis is used to explore the relationship between a dependent variable (e.g., housing supply) and one or more independent variables (e.g., home price, interest rates, employment rates). By understanding these relationships, analysts can predict how changes in economic conditions might affect the real estate market.
- Linear Regression: This is the most basic form of regression analysis, used to predict the value of a variable based on the value of another variable. For instance, it can model how changes in the GDP impact residential property values.
- Multiple regression: This more complex form involves multiple independent variables, offering a nuanced view of how various factors collectively influence real estate prices.
Figure 2 is a good example of a regression analysis that compares the available housing supply with the percent change in housing cost. It also shows a time series analysis by identifying the seasonal effects in housing demand. Cold weather tends to increase the housing supply, as shown by the labels A and C, while warm weather tends to decrease the housing supply, as indicated by labels B, D, E and F.
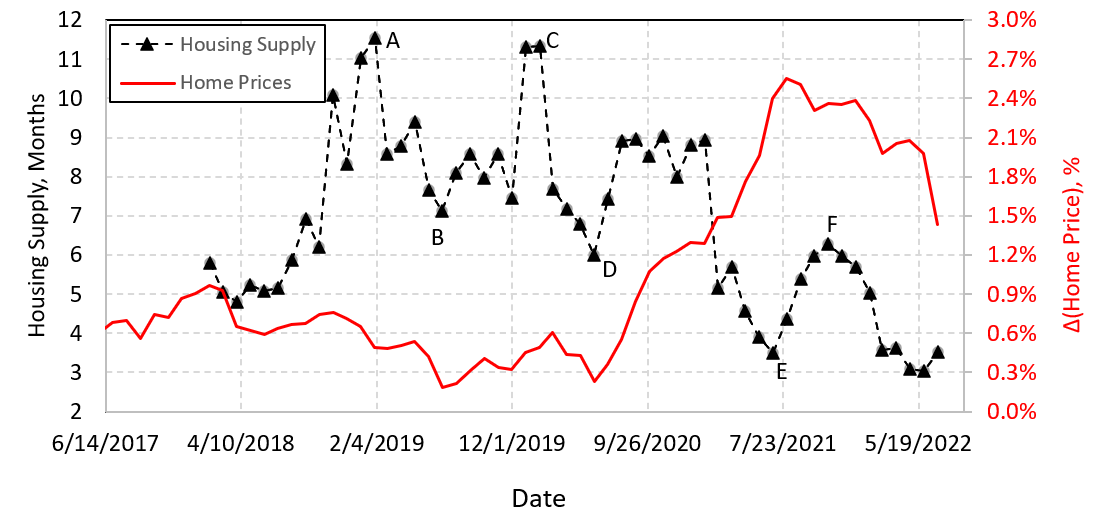
Figure 2. Housing Supply vs Time on the left axis is compared with % Change in Housing Price on the right axis. (Source: https://www.zillow.com/research/)
Monte Carlo Simulations for Risk Assessment
Monte Carlo simulations are used to model probability of different outcomes in processes that cannot easily be predicted due to the intervention of random variables. In real estate, these simulations can assess the risk and uncertainty in investment returns by considering the variability in market conditions, interest rates, and other factors that impact investment outcomes.
Predictive Modeling for Investment Strategies
Predictive modeling involves creating statistical models to forecast future market conditions. Techniques like machine learning can be particularly effective, as they automatically refine their predictions as more data becomes available.
- Machine Learning Algorithms: They can be trained on historical real estate data to identify patterns and predict future market trends, such as the likelihood of price increases in specific neighborhoods.
Challenges and Ethical Considerations
While statistical analysis can significantly enhance understanding of the real estate market, analysts must be mindful of the quality and sources of their data. Ethical considerations also come into play, particularly with predictive modeling, in ensuring transparency and fairness in how models are used to make investment decisions.
Conclusion
A statistical approach offers a powerful toolkit for deciphering the complexities of real estate market dynamics. By employing methods like time series analysis, regression analysis and Monte Carlo simulations, stakeholders can gain a deeper understanding of market trends and more accurately predict future movements. As we continue to explore the quantitative aspects of real estate analysis, the subsequent articles will delve into specific statistical tools and their applications in greater detail.
Thanks for reading,
-Scott
Further Reading
My Blog: Blog – Scott Stanfield (scottastanfield.com)
My Book: Passive Profits: The Turnkey Rental Investor’s Guide
Mastering the Market Cycle: Getting the Odds on Your Side by Howard Mark